Implementing CPQ unlocks a wealth of new data points and functionality for the organization, alongside reports, analytics, and deeper management capabilities across the sales and fulfillment cycles. However, identifying key performance metrics that represent a true return on the investment, as indicators of implementation success and overall organizational improvements, can be hard to define.
Here, we present and describe examples Simplus has identified as valuable Key Performance Indicators that your team should be considering at every stage of the CPQ implementation roadmap. We also provide a high-level framework around what to consider when building out your own KPIs, relative to your business.
These samples and frameworks can be used as templates for management and operations to determine, realize, and grow the value of their overall CPQ and Salesforce investment. Moreover, it hopefully encourages both new and existing users alike to consider the immense value that well-defined KPIs can bring to the organization.
Setting up a KPI Framework
Performance indicators are only valuable when they promote action around the organization’s strategic objectives, and they can only be delivered when relevant measurements and metrics are available.
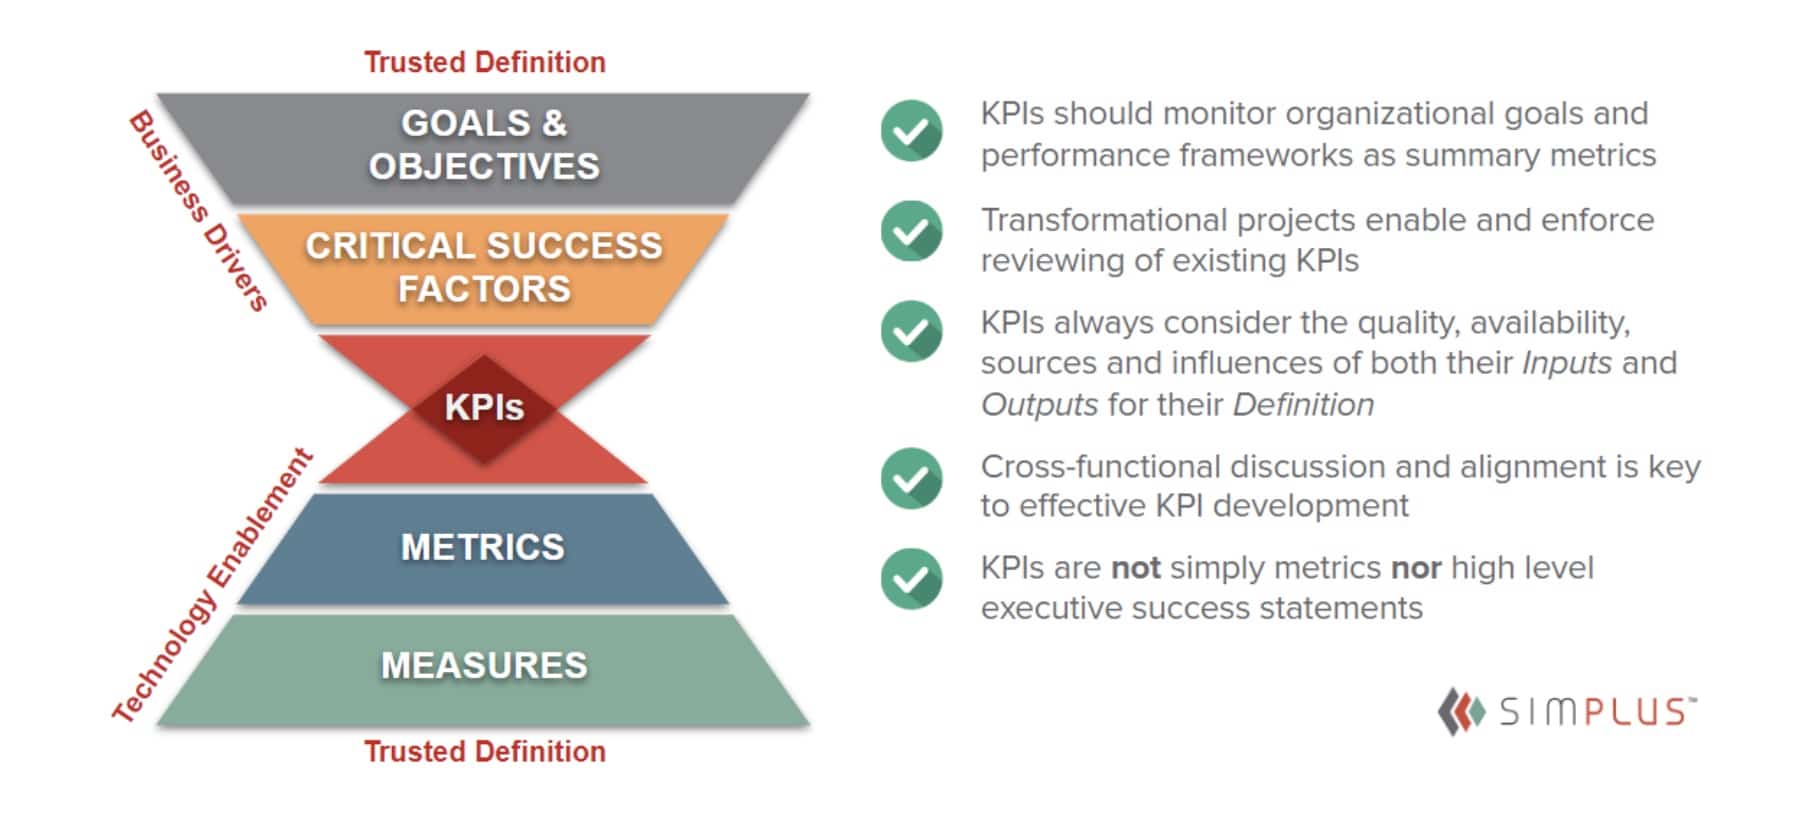
When considering building your KPIs, start at the highest level—your mission or vision statement—and work through the critical business drivers and associated activities to achieve this. Clarify what should be measured. Then, move into your systems and data sources to identify how technology enables or makes available the required data points needed to feed the indicators.
When building your KPIs, ask yourself questions such as:
Do we have an accurate, valid mission statement we all buy into, with goals and objectives that will help define our KPIs as promoters toward this mission?
Are we enabled with the appropriate technology and processes to deliver trusted KPI data and results we can take action on?
Have we looked beyond the scope of available tools and processes to ensure we are measuring truly valuable performance indicators?
How will we react to both positive and negative deviations shown on our KPIs?
Will we be able to easily trace KPI anomalies and results “downwards” to identify and remedy potential causes and “upwards” to validate and assess strategic impact?
Is the KPI an ongoing, targeted rate (continual improvement) or will it deliver a new performance benchmark and what/when will this benchmark be?
Are we able to produce baseline measures to measure our KPIs against moving forward? (Consider ways to turn qualitative data into quantifiable metrics, such as initial and scheduled surveys.)
Remember that over time your systems and goals change, so your KPIs may need to be periodically revisited or replaced too. But how often? Generally, if a KPI no longer represents a trusted indicator of a company’s progress towards its objectives, from which people are taking immediate action, it is likely time for it to be refreshed.
There are many other frameworks and analysis approaches toward building out your KPIs. The most important thing to remember is that a KPI is intended to provide uncontested, data-driven decision-making capabilities. If your car’s dashboard shows it is overheating, you instinctively know to stop the car, check the coolant, drive slowly, and keep an eye on the gauges to see if it’s time to fix something potentially broken or dangerous. Similarly, if your company KPIs show an anomaly, you need to trust their measurement mechanisms, have a corrective course of action, and then monitor them closely since they are aligned with and promote the health of the business.
Sample KPIs for Quote-to-Cash/CPQ implementations
Salesforce CPQ, and the associated adjustments and customizations it often entails, immediately delivers an impressive amount of data points across the product and sales management processes. The entire quote-to-cash lifecycle, including the products, sales cycle, pricing structures, contracting, order management, and more can be interrogated to feed the KPIs you have defined as mission-critical waypoints on your company’s map toward success.
Be careful to differentiate project deliverables versus actual KPIs. The former is a targeted output result with a defined lifespan; the latter is an ongoing, continual improvement measurement against a benchmark, usually without a defined target.
Below are some valuable, if not obvious, KPI data points you may want to consider benchmarking and measuring as part of your organization’s overall performance dashboard. Or you could simply stem a conversation around these data points. Note that these examples adopt the SMART methodology, as any KPI should: Specific, Measurable, Attainable, Realistic, and Time-based.
SKU Count & Proliferation
If your organization has a product catalog many times larger than they feel it should be, CPQ can group SKUs into categories and classifications, separate these individual characteristics from point-of-sale mechanisms, and significantly reduce thousands of itemized SKU definitions using customizable logic and rules. This also places frameworks and controls around product development and cataloging processes to ensure new products slip easily into your CPQ sales operations and automations.
Example: Annual SKU count: >5% increase.
Whitespace Targeting
With properly classified products, it becomes easier to analyze dormant or low-volume accounts’ purchase histories against those of higher volume, similar accounts You can then determine a strategy to address this opportunity whitespace.
Example: Quarterly % of customers with > $10,000 spend: reduce by 2% QoQ.
Quote/Opportunity Turnaround Time & Volume
Establish a benchmark around how long it takes for a customer inquiry to move through its contributors and approvals into the quoted stage; CPQ automates and streamlines these processes, thus a decrease in quote turnaround time should be expected. An expected outcome of faster throughput is also a higher volume of quotes that can be produced by every salesperson using CPQ.
Example: Count of Quotes delivered per month: increase by 1%; Average time between Opportunity Open and Close: decrease by 10%.
Average Order Value
By automatically adding or recommending complementary products at the point of quoting (“solution selling”), customers are more likely to increase the overall value of their order. This KPI can be further analyzed by running sales performance measurements across products known to be “cross-sell” or “up-sell” SKUs.
Example: AOV per Quarter: increase to 12% of TOV and maintain; Product Line X sales performance for FY19: increase to $100,000.
Sales Staff Onboarding Time/Effort
Complicated sales processes can be reduced into logical solution development paths using CPQ guided selling, product and pricing rules, and other features. These allow even newer sales reps to build and deliver quotes that are commercially (protect your margin) and technically (deliver the product) viable without having to validate their proposals or request assistance, even when complex. Consider before/after/ongoing surveys to gather and quantify this data.
Example: Perceived proficiency timeframe: decrease to 3 months and maintain.
Fulfillment Variances
A common challenge is where the product sold simply is not the product the customer needs, but this is only discovered at the point of fulfillment. Whether miscommunication, expertise, or process is the cause, the time, effort, and reputation costs to deliver the appropriate solution impacts your bottom line. CPQ closes the gaps in solution selling complexities, which results in fewer variances between what was sold and what gets delivered and happier customers.
Example: Quarterly variances between Sold vs. Delivered: reduce to 5% and maintain.
Customer Churn & Renewals
For companies depending on recurring revenue through subscription-based offerings or service agreements, ensuring paying customers stay with you (or increase spend) is critical. Contract anniversaries are key times when customers are likely to churn. CPQ offers insight, forecasting, and even engagement recommendations leading up to every customer’s contract renewal date, ensuring sales reps reach out at the right time, with the right offer, to ensure you maintain your subscriber base and protect your revenue streams.
Example: Annual average customer renewal rate: maintain at 85%.
Back End Reconciliation
By handling complex pricing and discounting models in CPQ during the front-end of quoting and order processing, back-end ERP and financial systems are often freed up of maintaining these rules and logic, which they are typically not designed to perform in the first place. These systems can simply trust, compare, and use the inputs passed from CPQ to perform the financial transactions they were primarily designed for, with fewer reconciliation discrepancies between the sales and billing numbers.
Example: Monthly Order/Sales vs. Billing variances: decrease and maintain at >2%.
Strategic Market/Product Initiatives
Sometimes targeted campaigns are set up to address particular markets, verticals, or specific product penetration. By configuring products inside CPQ, as well as Salesforce Account and Opportunity data and processes, you can define KPIs that measure how well these specific market or product initiatives are performing overall, while CPQ ensures the strategy is being implemented.
Example: Increase Automotive product line: 15% QoQ for FY19.
Remember that these are just illustrative examples of common measurement areas that a well-designed CPQ implementation enables. Depending on the nature and nuance of your business, you may discover other areas to monitor critical performance. In some cases, where your KPIs have been thoroughly validated against business goals, you may even consider designing, reverse-engineering, or enhancing your CPQ design to deliver the KPI data you need.
Well-crafted KPIs are the GPS on your travels towards your company goals, but they are only effective when fed accurate data from well-adopted systems, mapped against a desired destination, and observed by users willing to take course-correcting action. If they are simply not used, not trusted, or completely ignored, you may navigate your business into a bad part of town, with no idea how you got there.


0 Comments