As we discussed in my last blog, your Salesforce instance is a treasure trove of valuable components that, when used correctly, can drive insurmountable power into your organization’s sales efforts. However, the same motif rings true from my previous post: Salesforce can be a difficult terrain to navigate, and without the proper knowledge of all the nooks and crannies that exist across the landscape, you might be walking right over some helpful tools. Here, I’ll outline three more facets found in your Salesforce instance as we continue our quest to find all the hidden gems of Sales Cloud.
Forecasts
The literal definition of ‘forecast’ is to be able to predict a future event or trend. In a vacuum, you want your sales cycle forecastable—that is, to be predictable and cyclical. The forecast tool makes this possible.
In Salesforce, Forecasts allow you to predict and plan the sales cycle based on your Opportunities. The Opportunities are segmented into 4 forecast categories:
Pipeline — Typically includes open Opportunities with less than a 50% Probability to close. Some sales orgs include a 0%/Omitted option for budgetary or pre-qualified deals, and these would not be in your Forecast at all.
Best Case — Usually Opportunities between 50–75%
Commit — Usually Opportunities between 75–99%. Oftentimes, there will be a “Sales Closed Won” stage at 99% which is the furthest the Sales Rep or Opportunity Owner can take the deal. Then finance or another approval step must happen for the Opportunity to be officially Closed Won/100%
Closed — Only includes Opportunities in Stages indicated as Closed Won
When you set up Stages, you are actually defining how that stage will work within your Forecast. Within each Stage, you determine which forecast category it should fall into, its default probability, and whether it counts as Open, Closed Won, or Closed Lost in the Type column. See below for an example:
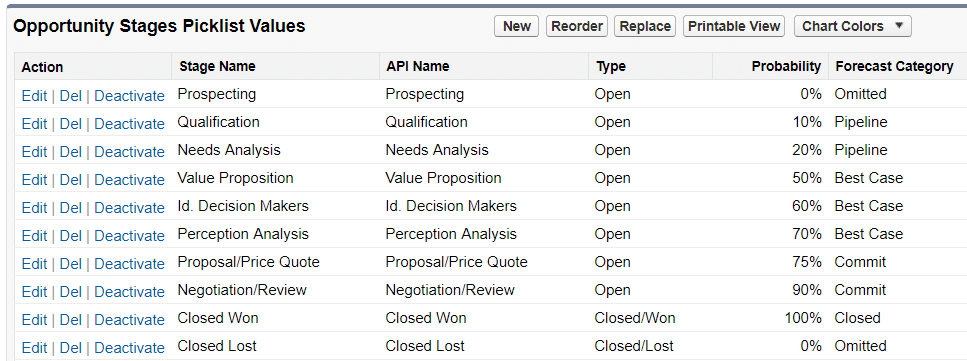
This allows the Forecast Category to update automatically as the Stage field changes (though you can also allow users to override this). Opportunities are also segmented into Close Date, allowing you to manage your pipeline within a select time frame (i.e. quarterly or monthly).
From there, your opportunities can be summed in a few different ways. The most common is by the Opportunity Amount (Revenue Forecasting). In this scenario, you see the total value of all the opportunities within the time frame, which are grouped by Forecast Category.

There are a few other top Forecast Types:
Opportunity Count — If you track the number of deals sold and not the dollar value.
Product Family Amount or Count — If you need to report on a few main types of products, like Hardware, Software, and Services.
Opportunity Splits — When you need to attribute a portion of the amount to a few different sales reps.
These are the main types of Forecasts that you might find beneficial. A full list of Forecast Types can be found here.
Feed-Based Page Layouts
 You are undoubtedly aware of how quickly client information and communication can become muddled across multiple interfaces within your Salesforce org. This is where Feed-Based Page Layouts can really play to your advantage.
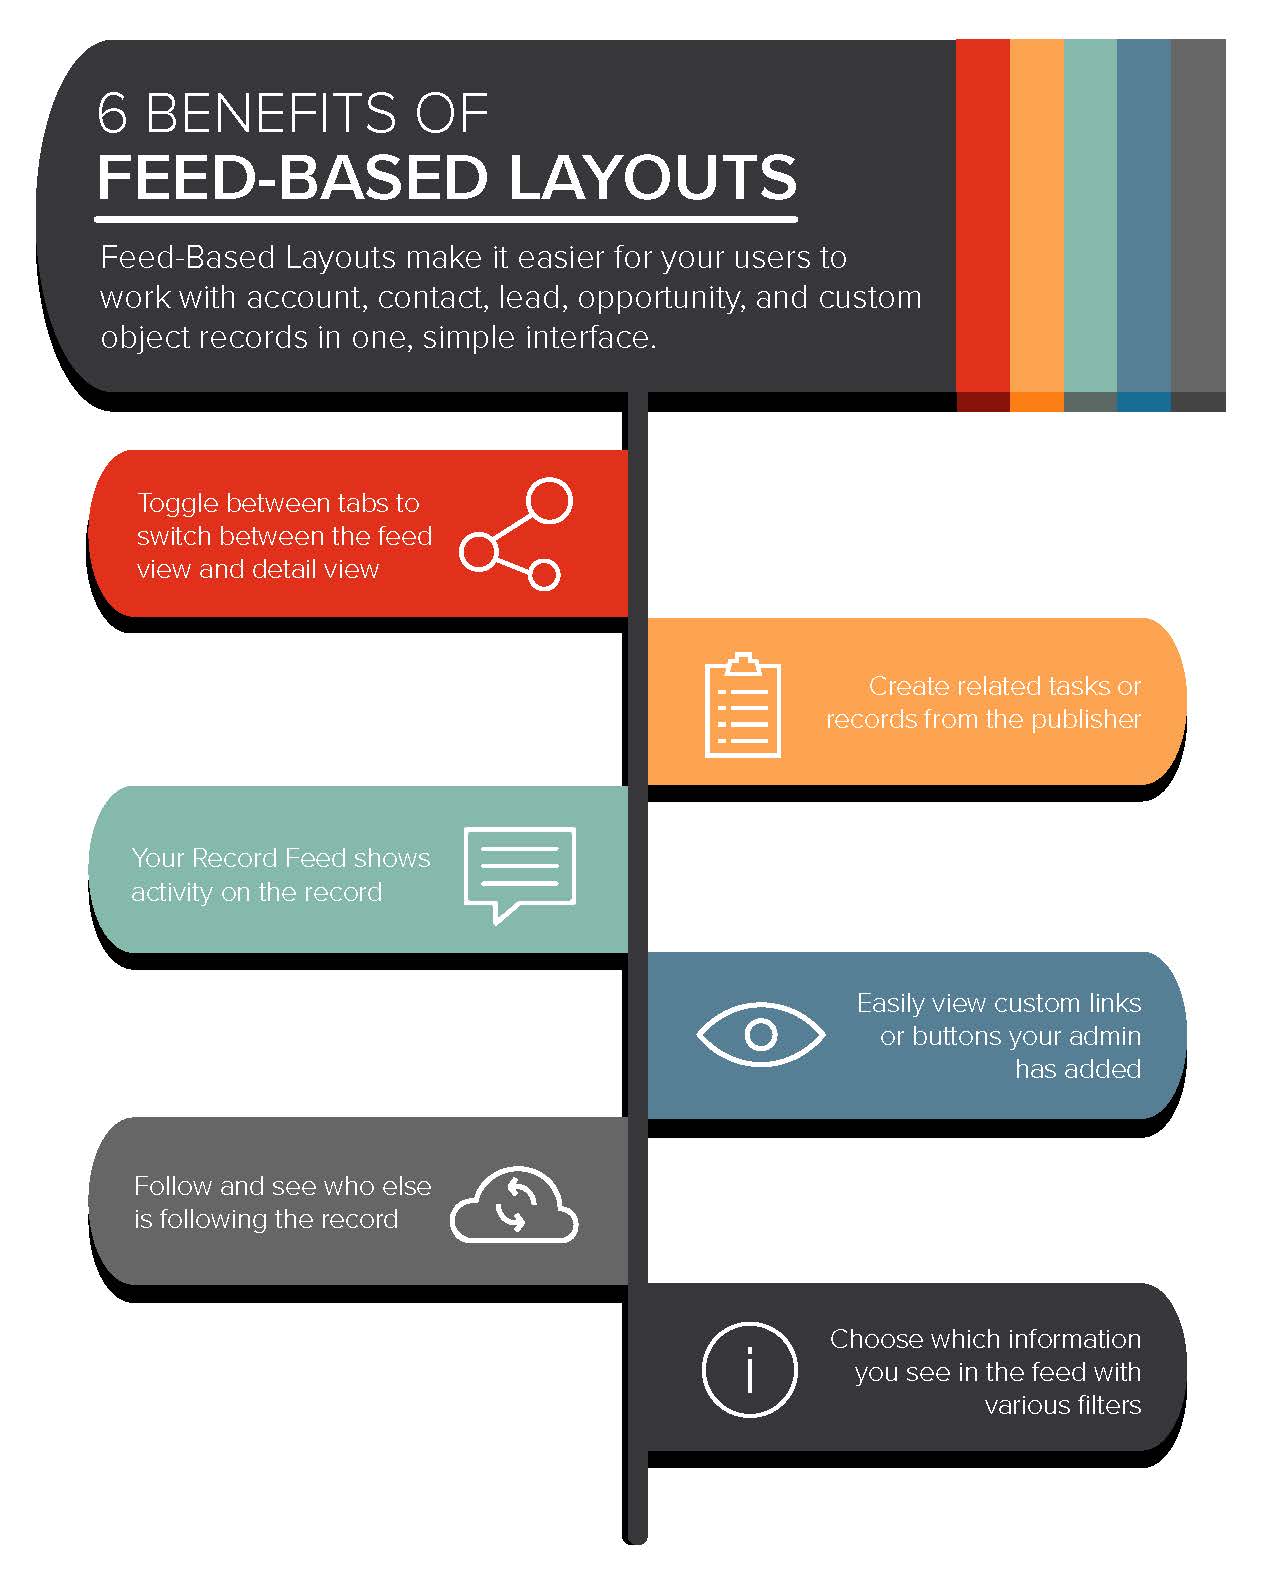
The Feed-Based Layout option allows you to split Chatter information and Record Details into two sub-tabs. This allows Chatter to have even more features on record pages, such as Feed Filters, while not taking up space on the record detail page. This is super helpful when you have records with a long chatter history or when collaboration is key to your process. Cases and Opportunities are a great place to start with Feed-Based Layouts.
Schedule or Subscribe to Reports and Dashboards
Scheduling dashboards can meet a few needs. For one, when applied to Dashboards, Scheduling can ensure the Dashboard was recently refreshed whenever users access it. I consistently get questions about why data doesn’t seem right on a dashboard, when often the problem is just that the dashboard wasn’t refreshed in months.
The main value from scheduling Reports and Dashboards though is getting your analytical data emailed to you on a defined recurrence. While we would hope all our users and managers are accessing Salesforce often and seeing their KPIs in real-time, there’s always a few people who would prefer to get a weekly email showing a snapshot.
You can also utilize the Subscribe feature to add advanced audit capability. Aside from just receiving the report on a recurring basis, you can also conditionally define when you receive the report. For example, you might not want a report of all your Urgent Cases on a daily basis, but you may want the report if the total number of Urgent Cases exceeds 20.
Scheduling or Subscribing works differently in Classic and Lightning (respectively). To learn more and find out how you can set this up, check out this article.
On the outset, Sales Cloud can be an intimidating environment to dive head first into. However, if you know what features to use and when, you’ll find that there’s a bounty of value to harness in your sales process. Be sure to keep an eye out for my next blog to learn about more awesome Sales Cloud features!


0 Comments